Histogram tool
The Histogram tool displays velocity and MIDI CC values as a chart, with values grouped according to their frequency distribution. It allows you to change values on a large scale, including across entire tracks; for example, increasing all velocity values proportionally.
-
You can show the Histogram tool in the Velocity and MIDI CC editors by clicking Histogram
 in the corresponding editor header.
-
Chart shape
Allows you to change the shape of the Histogram chart.
-
Bars
 : Values are displayed as bars.
 -
Area
 : Values are displayed as an area.
-
-
Histogram filter
Allows you to filter the values shown in the Histogram tool.
-
All/All notes: Shows all values for all instruments currently shown in the Key Editor.
-
Voice: Shows only notes in the selected voice. Only available in the Velocity editor.
-
Selection: Shows only values for selected items.
-
-
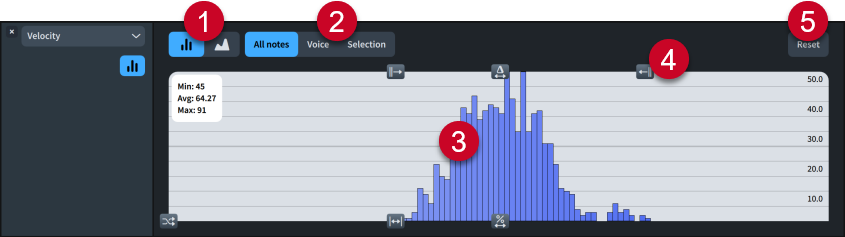
Histogram chart
Shows values according to the selected filter. The X axis represents numerical values, while the Y axis represents the frequency distribution of the corresponding values.
-
Histogram controls
Allow you to change the values currently in view.
-
Reset
Resets all values currently in view.
If you want to change values on a smaller scale, you can use the Transform tool.