3D Analysis Options
In the options dialog of the 3D Frequency Analysis dialog, you can define which frequency range is analyzed and modify the appearance of the graph for the 3D frequency analysis.
-
In the 3D Frequency Analysis dialog, click the 3D Analysis Options button.
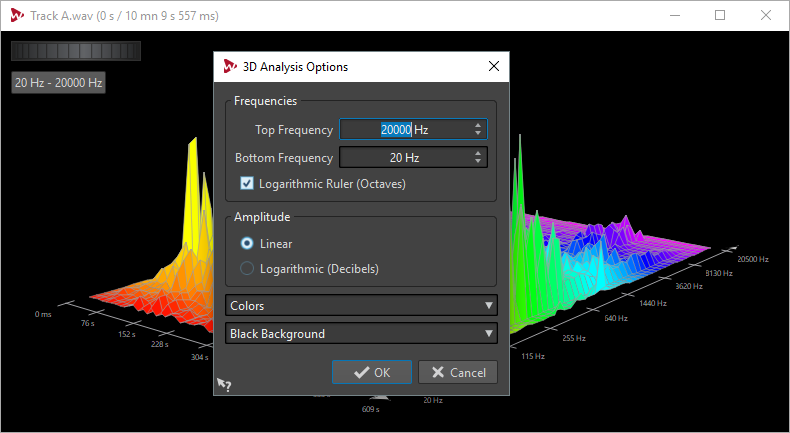
- Top/Bottom Frequency
-
Specifies the highest/lowest frequency of the range.
- Logarithmic Ruler (Octaves)
-
Divides the frequency ruler in equally spaced octaves.
- Amplitude
-
Select whether you want the peaks to be proportional to their amplitude (Linear) or to their power (Logarithmic with Decibel Scale).
- Colors
-
Defines the color scheme of the graph.
- Background
-
Defines the background color.