3D Frequency Analysis
Using the 3D Frequency Analysis, you can view an audio file in the frequency domain.
Use the 3D Frequency Analysis for the following:
-
Viewing the frequency spectrum distribution in a mix
-
Identifying which frequencies can be reduced or boosted as a basis for equalizing
-
Viewing parts of the frequency spectrum that are occupied by a background noise that you want to filter out
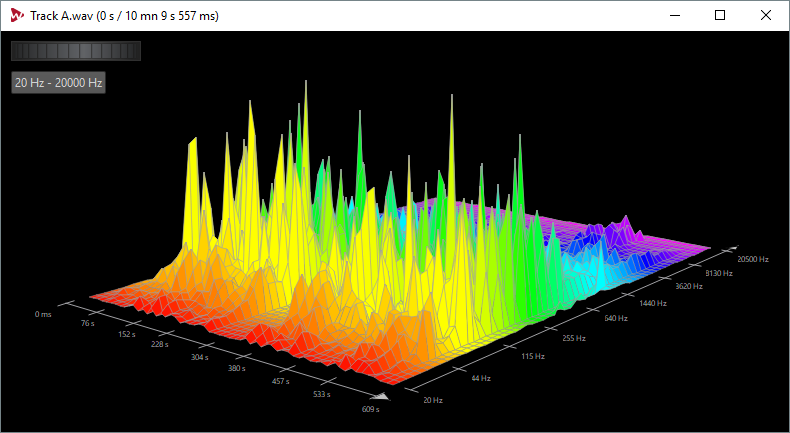
A wave display (time domain) informs you about the start and end of a sound in a file, but lacks information about the timbral contents of the file that a frequency graph (frequency domain) provides. The graph that is used in WaveLab Pro is often referred to as an FFT (Fast Fourier Transform) plot. If you select a stereo recording, a mix of the two channels is analyzed.
The wheel control allows you to view the frequency spectrum from different angles. For example, you can open several 3D Frequency Analysis windows, each with a different perspective. This allows you to get a better view of an otherwise crowded graph.