Loudness Display
The curves on the Loudness display represent the loudness over time in an audio file.
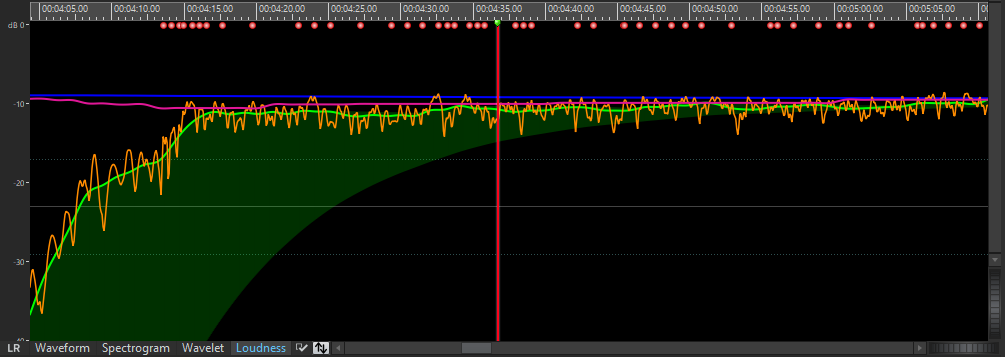
Because isolated peaks do not alter the perceived loudness of audio material very much, this display represents the loudness of an audio file more accurately than the waveform display.
This display mode also gives you an overview of the compression or dynamic range of an audio file. For example, the more peaks and valley expressions in the curve, the more dynamics in the audio. An even curve with few peaks indicates that the material is compressed with a limited dynamic range.