Spectroscope
The Spectroscope shows a graphical representation of the frequency spectrum, analyzed into 60 separate frequency bands, represented as vertical bars.
-
To open the Spectroscope, select .
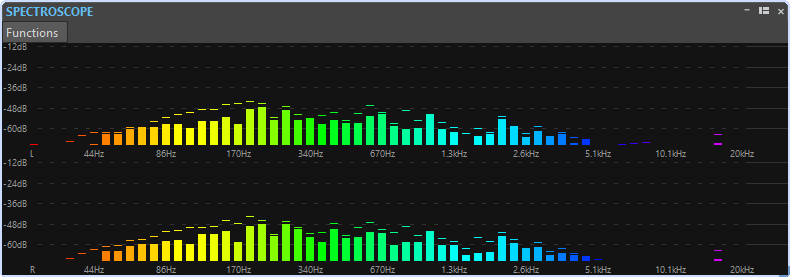
Peak levels are shown as horizontal lines above the corresponding bands, indicating recent peak/maximum values. The Spectroscope offers a quick spectrum overview. For a more detailed analysis of the audio spectrum, use the Spectrometer.
On the Functions menu, you can specify whether only high audio levels are displayed, or whether medium and low levels are also shown.
The following settings are available:
-
Restrict to High Audio Levels
-
Include Medium Audio Levels
-
Include Low Audio Levels