DDP Player Window
The DDP Player window displays the tracks and the corresponding attributes of the DDP image. You can play back the tracks and analyze them with the peak meter.
DDP Image Information

The DDP image information section displays the album title, artist name, and the UPC/EAN number of the DDP image.
Track List
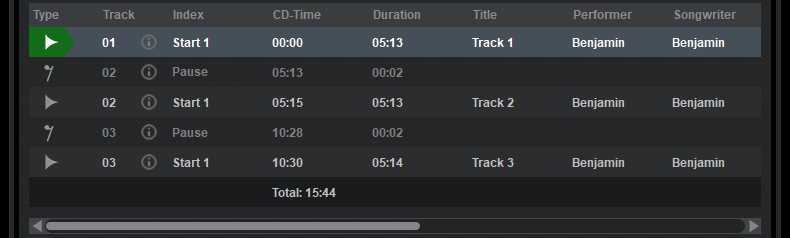
The track list displays the tracks and the pause tracks. The total DDP image time is displayed below the track list.
- Attributes
-
The attribute columns give information about each track. You can drag the attribute names to rearrange the order of the attribute columns.
The following attributes can be displayed:
-
Type
-
Track
-
Index
-
CD-Time
-
Duration
-
Title
-
Performer
-
Songwriter
-
Composer
-
Arranger
-
Message
-
ISRC
-
User Text
-
- Track list
-
Displays the tracks of the DDP image. To display information about a track, click the i icon
Transport Bar
With the transport bar you can control playback of the DDP image.
- Playback position
-
The playback position slider displays the playback position of the selected track. You can drag the slider to jump to another playback position. The Time value displays the playback position of the selected track. You can click the CD Time value to display the playback time or the remaining playback time of the DDP image.
- Skip to previous track
-
Skips to the previous track.
- Skip to next track
-
Skips to the next track.
- Stop playback
-
Stops playback. If playback is already stopped, the playback position jumps to the beginning of the selected track.
- Start playback from cursor
-
Starts playing back the selected track from the current playback position.
- Volume
-
Allows you to control the playback volume.
Peak Meter

The true peak meter displays RMS values according to the AES17 standard which adds a 3 dB offset. The maximum peak hold values are displayed with yellow lines. The current peak level is displayed with blue bars.