Spectral Domain Modules
The modules in this category allow you to visualize spectral information about the audio signal.
The following modules and module-specific settings are available:
Spectrum Curve
This module uses FFT (Fast Fourier Transform) techniques to show a frequency graph, providing a precise and detailed real-time frequency analysis.
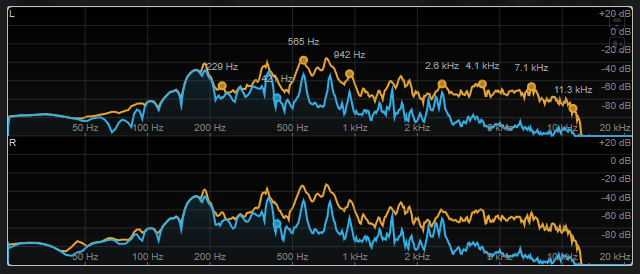
The display shows the frequency spectrum as a linear graph. If you move the mouse pointer over the display, a peak curve is shown in orange. Move the mouse pointer over the curves to show the local maximum values in Hz. Press Ctrl/Cmd to show the maximum values in dB or press Shift to show their pitch.
When using side-chaining, this module also allows you to detect the regions in your main signal that are acoustically masked by the side-chain signal.
In addition to the signal of the track, the display can show the signal of a side-chain input. For this to work, you must select a Main & Side-Chain view from the channel selector. The side-chain signal is then shown in white.
The following module-specific settings are available in the Module Settings window:
- Time Smooth
-
Smoothes the temporal display of the spectrum curve.
NoteAlternatively, you can move the mouse pointer over the selected module, hold Alt, and use the mouse wheel to adjust this parameter.
- Peak Fallback
-
Sets the speed of release for the spectrum curve and the peak curve.
Note-
Alternatively, you can move the mouse pointer over the selected module, hold Ctrl/Cmd, and use the mouse wheel to adjust this parameter.
-
If this control is turned all the way to the left, the peak curve is disabled.
-
- Freq. Smooth
-
Smoothes the frequency display of the spectrum curve.
NoteAlternatively, you can move the mouse pointer over the selected module and use the mouse wheel to adjust this parameter.
- FFT Window
-
Sets the block size of the window that is used for the analysis. If Multi is selected, 3 different block sizes are used at the same time.
- Minimum
-
Sets the minimum value of the scale.
- Maximum
-
Sets the maximum value of the scale.
- Slope
-
Adds a slope to the frequency spectrum.
- Masking
-
If this button is activated, frequency ranges that are affected by a side-chain signal are displayed.
NoteFor this to work, you must activate side-chaining and select a Main + Side-Chain channel in the channel selector on the toolbar.
Spectrum Bar
This module shows a graphical representation of the frequency spectrum, analyzed into separate frequency bands, represented as vertical bars.
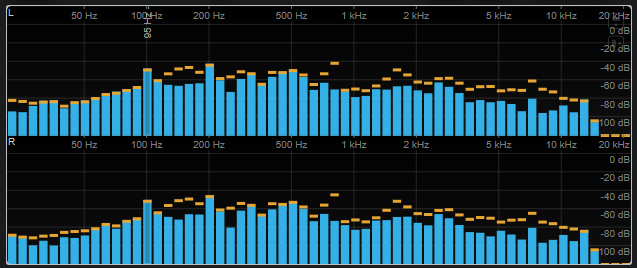
Move the mouse pointer over a bar to show the frequency range in Hz. Press Ctrl/Cmd to show the current value in dB or press Shift to show its pitch range.
The following module-specific settings are available in the Module Settings window:
- Time Smooth
-
Smoothes the temporal display of the spectrum curve.
NoteAlternatively, you can move the mouse pointer over the selected module, hold Alt, and use the mouse wheel to adjust this parameter.
- Peak Fallback
-
Sets the speed of release for the level meters and peak indicators.
Note-
Alternatively, you can move the mouse pointer over the selected module, hold Ctrl/Cmd, and use the mouse wheel to adjust this parameter.
-
If this control is turned all the way to the left, the peak indicators are disabled.
-
- Threshold
-
Sets a threshold level below which the display is masked.
NoteAlternatively, you can move the mouse pointer over the selected module and use the mouse wheel to adjust this parameter.
- Bands/Oct.
-
Sets the number of bands per octave.
- Minimum
-
Sets the minimum value of the scale.
- Maximum
-
Sets the maximum value of the scale.
- Slope
-
Adds a slope to the frequency spectrum.
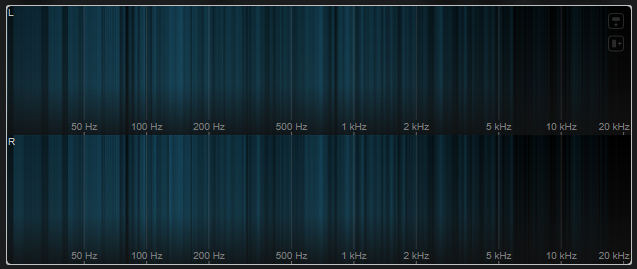
Spectrum Intensity
This module represents the frequency magnitude of the audio. The more intensely a bar is colored, the higher the magnitude at this frequency.
The following module-specific settings are available in the Module Settings window:
- Time Smooth
-
Smoothes the temporal display of the spectrum curve.
NoteAlternatively, you can move the mouse pointer over the selected module, hold Alt, and use the mouse wheel to adjust this parameter.
- FFT Window
-
Sets the block size of the window that is used for the analysis. If Multi is selected, 3 different block sizes are used at the same time.
- Minimum
-
Sets the minimum value of the scale.
- Maximum
-
Sets the maximum value of the scale.
- Slope
-
Adds a slope to the frequency spectrum.
Spectrogram
This module shows the last seconds of the audio stream. This allows you to detect disturbances in the spectrogram and to monitor the noise level and frequencies, for example.
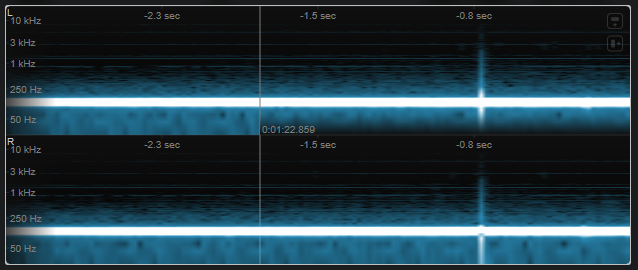
This module runs in Maximum Audio Performance mode.
The following module-specific settings are available in the Module Settings window:
- FFT Window
-
Sets the block size of the window that is used for the analysis. This allows you to adjust the trade-off between temporal resolution and frequency resolution. If you specify a higher value, more frequencies are analyzed but they are located less accurately in the time domain.
- Duration
-
Sets the duration of the audio stream that is displayed.
NoteAlternatively, you can move the mouse pointer over the selected module, hold Ctrl/Cmd, and use the mouse wheel to adjust this parameter.
- Color
-
Allows you to choose a color scheme.
- Minimum
-
Sets the minimum value of the scale.
- Maximum
-
Sets the maximum value of the scale.
Alternatively, you can move the mouse pointer over the selected module and use the mouse wheel to adjust the Minimum and Maximum parameters simultaneously.
Chromagram
This module displays a chromagram of your audio.
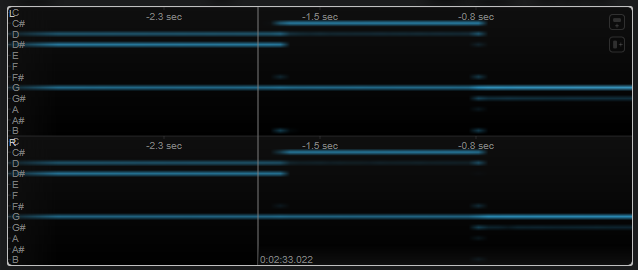
This module runs in Maximum Audio Performance mode.
The following module-specific settings are available in the Module Settings window:
- Duration
-
Sets the duration of the audio stream that is displayed.
NoteAlternatively, you can move the mouse pointer over the selected module, hold Ctrl/Cmd, and use the mouse wheel to adjust this parameter.
- Color
-
Allows you to choose a color scheme.
- Minimum
-
Sets the minimum value of the scale.
- Maximum
-
Sets the maximum value of the scale.
Alternatively, you can move the mouse pointer over the selected module and use the mouse wheel to adjust the Minimum and Maximum parameters simultaneously.